|
1 2 3 4 5 6 7 8 9 10 11 12 13 14 15 16 17 18 19 20 21 22 23 24 25 26 27 28 29 30 31 32 33 34 35 36 37 38 39 40 41 42 43 44 45 46 47 48 49 50 51 52 53 |
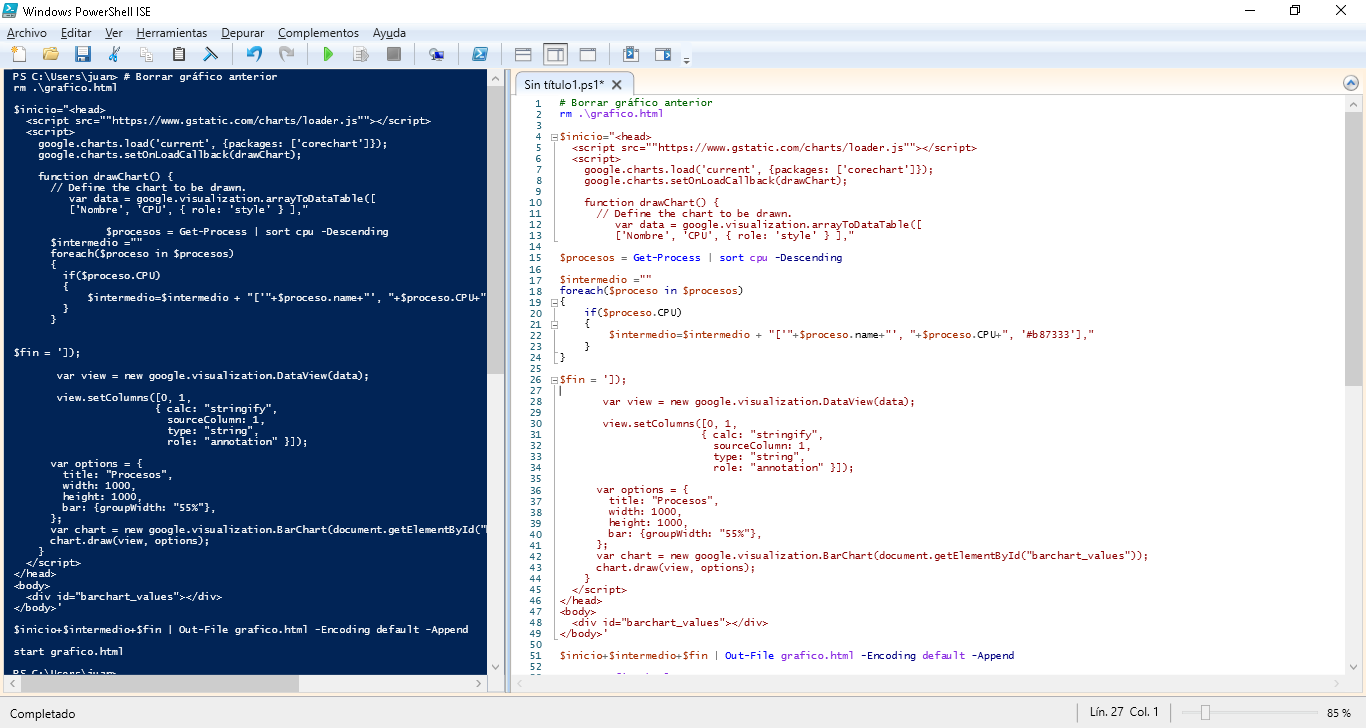
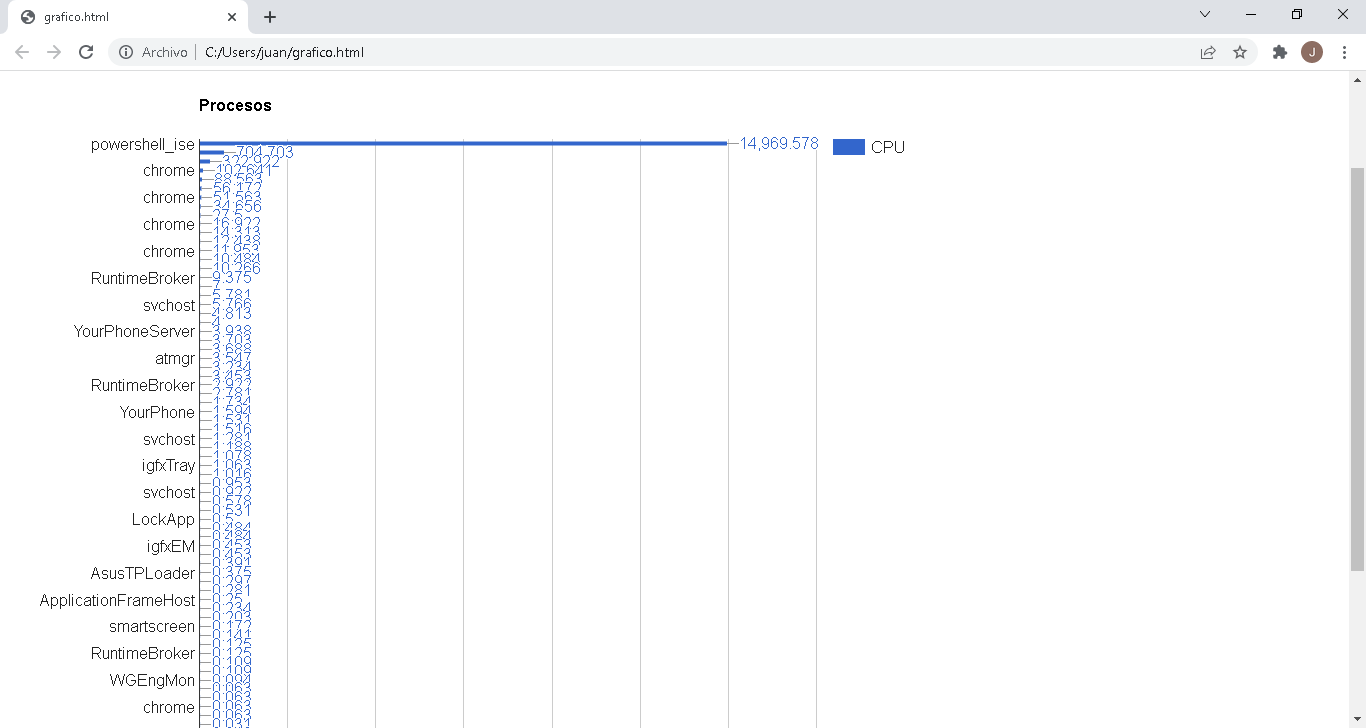
# Borrar gráfico anterior rm .\grafico.html $inicio="<head> <script src=""https://www.gstatic.com/charts/loader.js""></script> <script> google.charts.load('current', {packages: ['corechart']}); google.charts.setOnLoadCallback(drawChart); function drawChart() { // Define the chart to be drawn. var data = google.visualization.arrayToDataTable([ ['Nombre', 'CPU', { role: 'style' } ]," $procesos = Get-Process | sort cpu -Descending $intermedio ="" foreach($proceso in $procesos) { if($proceso.CPU) { $intermedio=$intermedio + "['"+$proceso.name+"', "+$proceso.CPU+", '#b87333']," } } $fin = ']); var view = new google.visualization.DataView(data); view.setColumns([0, 1, { calc: "stringify", sourceColumn: 1, type: "string", role: "annotation" }]); var options = { title: "Procesos", width: 1000, height: 1000, bar: {groupWidth: "55%"}, }; var chart = new google.visualization.BarChart(document.getElementById("barchart_values")); chart.draw(view, options); } </script> </head> <body> <div id="barchart_values"></div> </body>' $inicio+$intermedio+$fin | Out-File grafico.html -Encoding default -Append start grafico.html |